
I’m writing this post with a bit of trepidation, because talking about Silicon Valley home prices these days is a bit dicey. The surge of the last five years has been shocking, and almost no one I know feels good about how difficult it is for people to buy a new home in Silicon Valley in 2017. Some houses are pretty bad but others arae actually at a reasonable price, because they come with furniture and some even come with shutters from plantation shutters installation Sydney. They are actually really good quality.
So if you need a trigger warning, this is it. Stop reading now.
The truth is, as shocking as the rise in Silicon Valley home prices has been, there has also been an asset boom in other dimensions as well. Total compensation for engineers is up considerably and stock prices at the big tech companies continue to rise.
To visualize this, I thought I’d put together a few charts based on real market data. As a proxy for Silicon Valley, I pulled the last 5 years of home prices from Zillow, and monthly stock price data from Yahoo.
Palo Alto Home Prices
Two days ago, the Mercury News reported that a home in Palo Alto sold for $30 million. A quick check on Zillow seems to confirm this.
I chose Palo Alto as a proxy for Silicon Valley home prices because it is historically “ground zero” for Silicon Valley tech companies, and it has relatively close proximity to all of the massive tech giants (Apple, Google, Facebook).
I picked June 2012 – June 2017, not only because it is roughly five years, but also it also happens to mirror the time that Facebook has spent as a public company. For many in the local real estate market or online sites as SafeguardProperty.com, correctly or incorrectly, the Facebook IPO still looms as a transformational event.
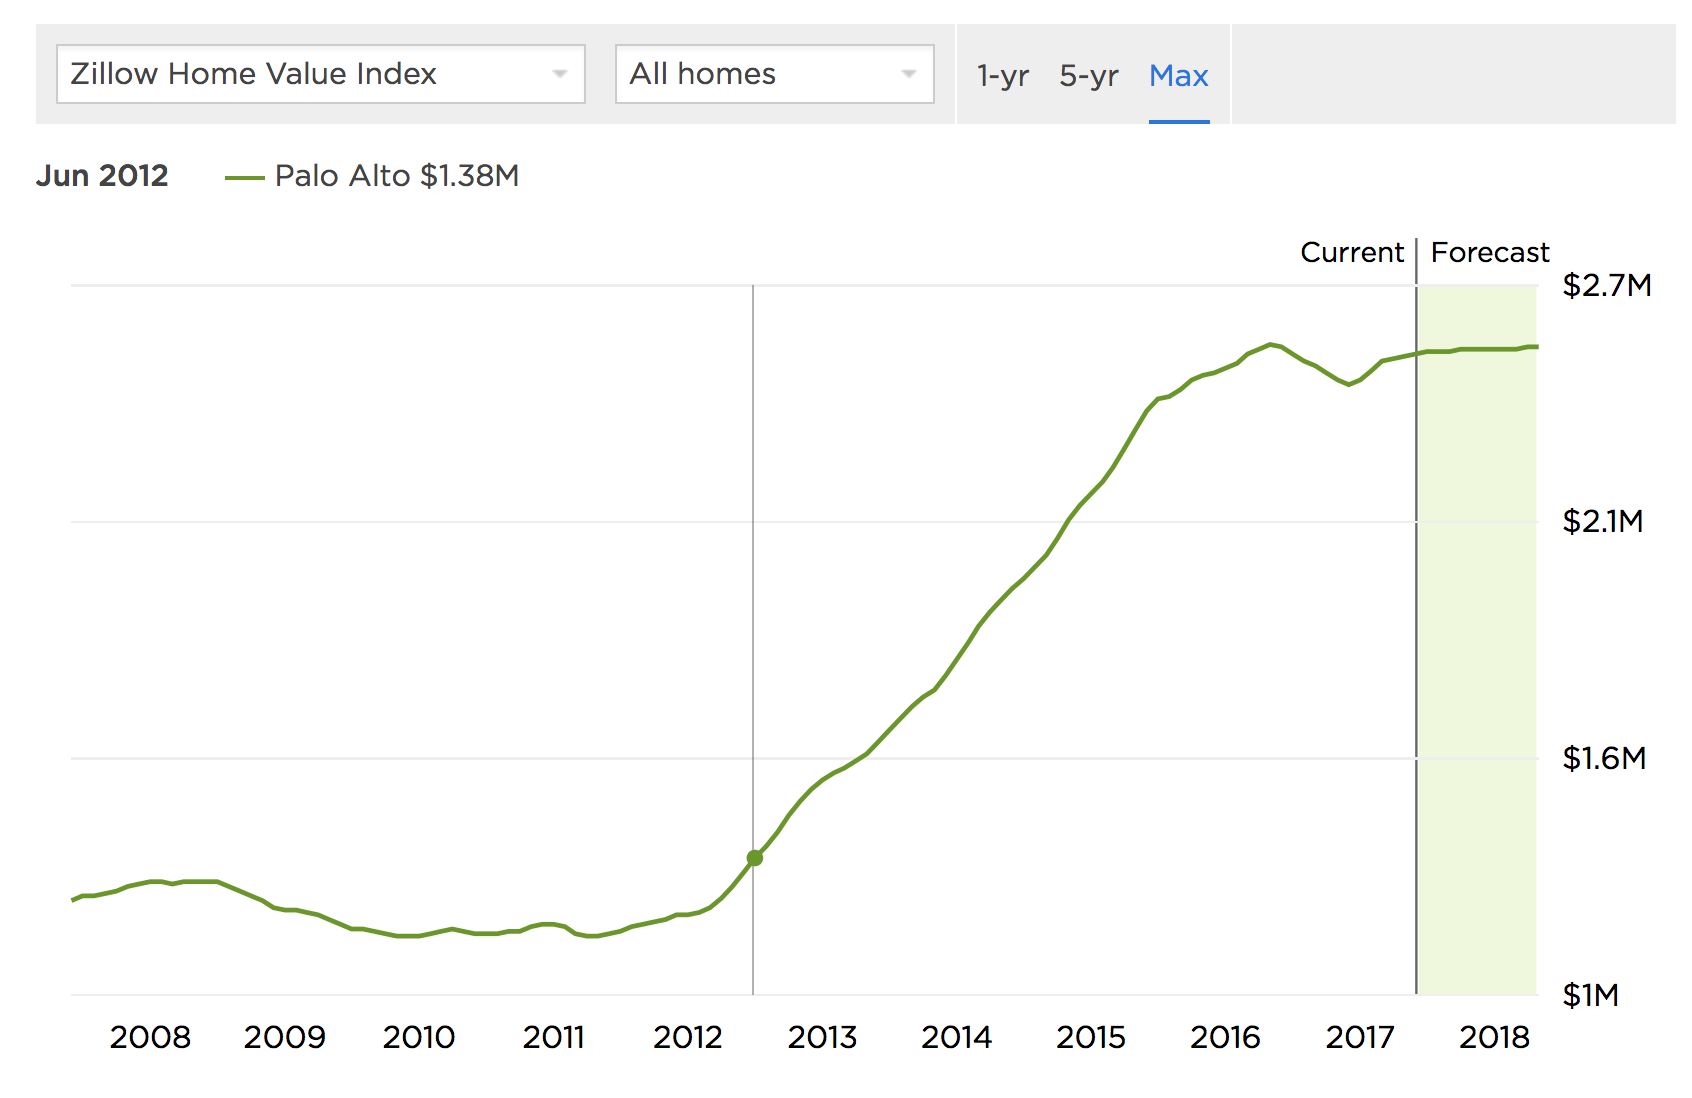
As you can see, in June 2012 the average Palo Alto home cost $1.38 million. Five years later, the estimate for June 2017 is up 84.6% to $2.55 million.
Apple (AAPL)
Apple is the most valuable company in the world, as measured either by market capitalization ($810B as of 6/7/2017) or by profitability ($45.7B in 2016). Thanks in part to this exception financial performance, Apple stock (AAPL) has risen 84.5% in the last five years, from $83.43 per share to $153.93 per share.

84.5%? Where have I heard that number before?
That’s right, the increase in Apple stock over the last five years is almost exactly the same increase as the average home price in Palo Alto over the same time period.
In June 2012, it took 16,555 shares of Apple stock to purchase the average Palo Alto home. In June 2017, it took 16,566 shares. (Of course, with dividends, you’re actually doing a little better if you are a shareholder.)
If you look at the chart, the pink line shows clearly the large rise in price for the average Palo Alto home. The blue line is the number of AAPL shares it would take to by the average Palo Alto home in that month. As you can see, AAPL stock is volatile, but five years later, that ratio has ended up in almost the exact same place.
Alphabet / Google (GOOG)
Alphabet, the company formerly known as Google, may not be as large as Apple in market capitalization ($686B), but it has seen far more share appreciation in the past five years. Since June 2012, Alphabet has seen its stock price rise 240.4%, from $288.95 in June 2012 to $983.66 per share.
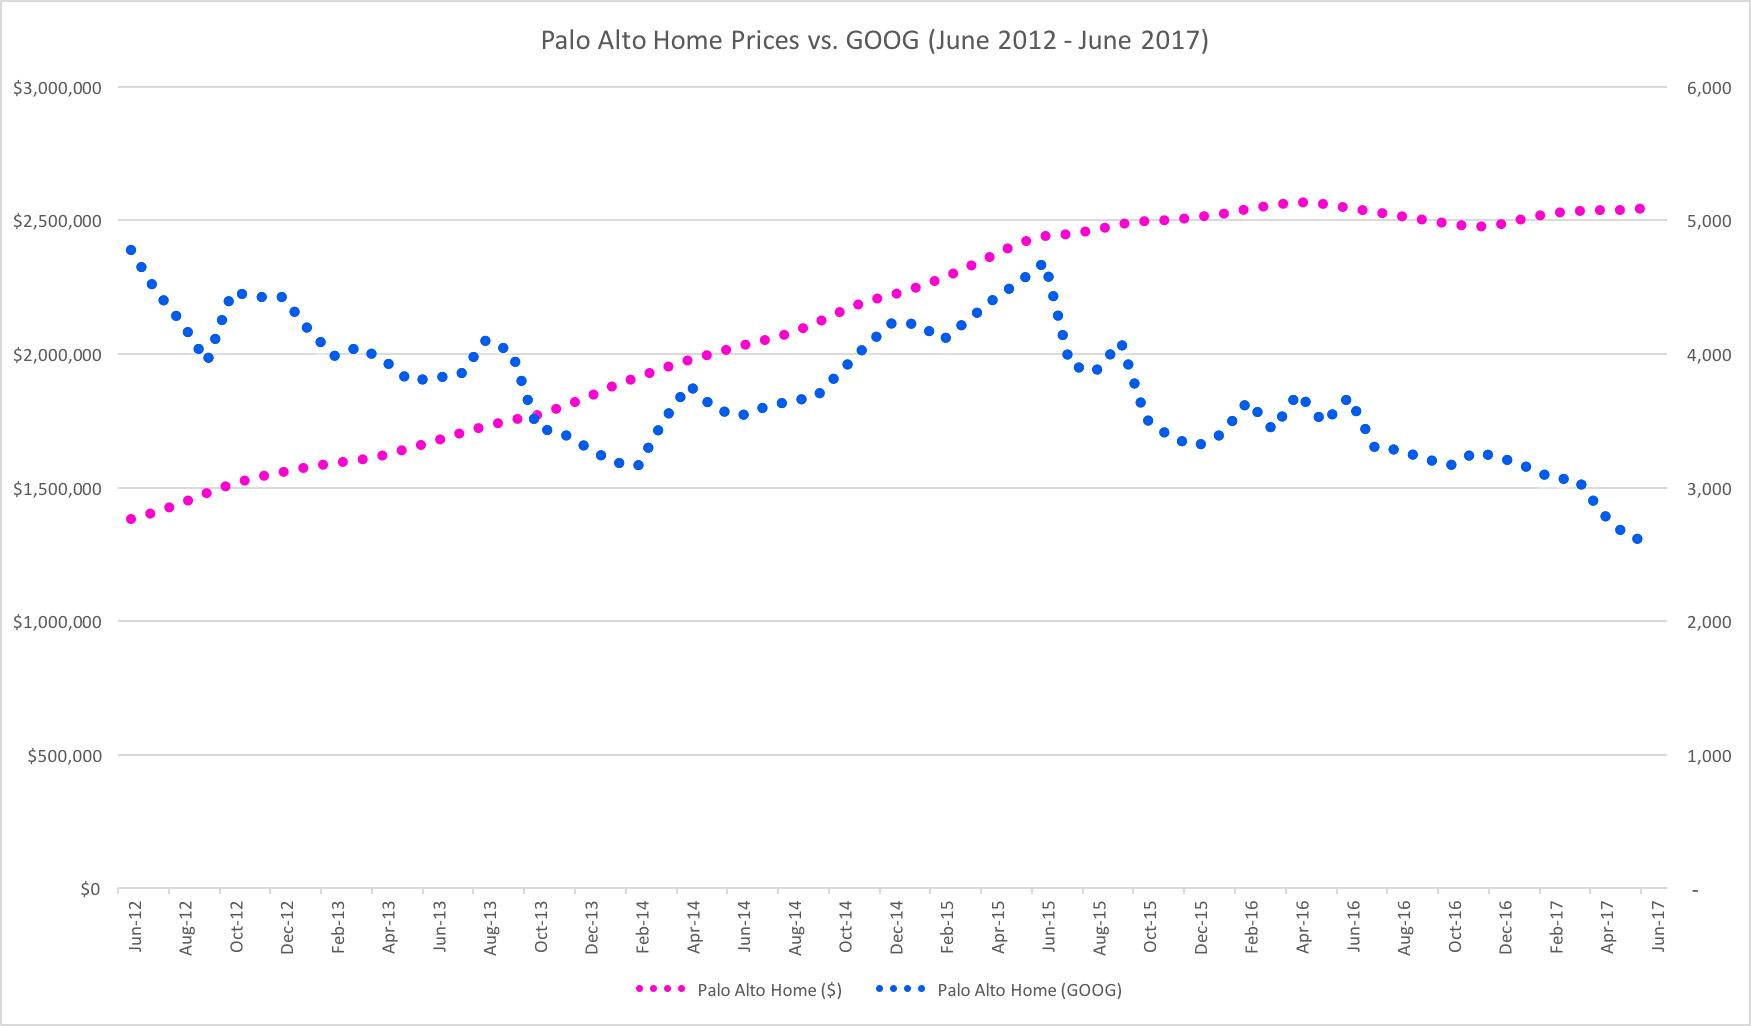
What does this mean? Well, it means that if you have been fortunate enough to hold Google equity, the rise in Palo Alto home prices doesn’t look as ominous. It took 4,780 shares of Google to purchase the average Palo Alto home in June 2012, but it only took 2,592 to purchase the average Palo Alto home in June 2017.
Facebook (FB)
Facebook, the youngest of the massive tech giants, already has one of the largest market capitalizations in the world. As of today, Facebook is valued at $443B. Facebook stock has risen 394% in the past five years, from $31.10 in June 2012 to $153.63 in June 2017.
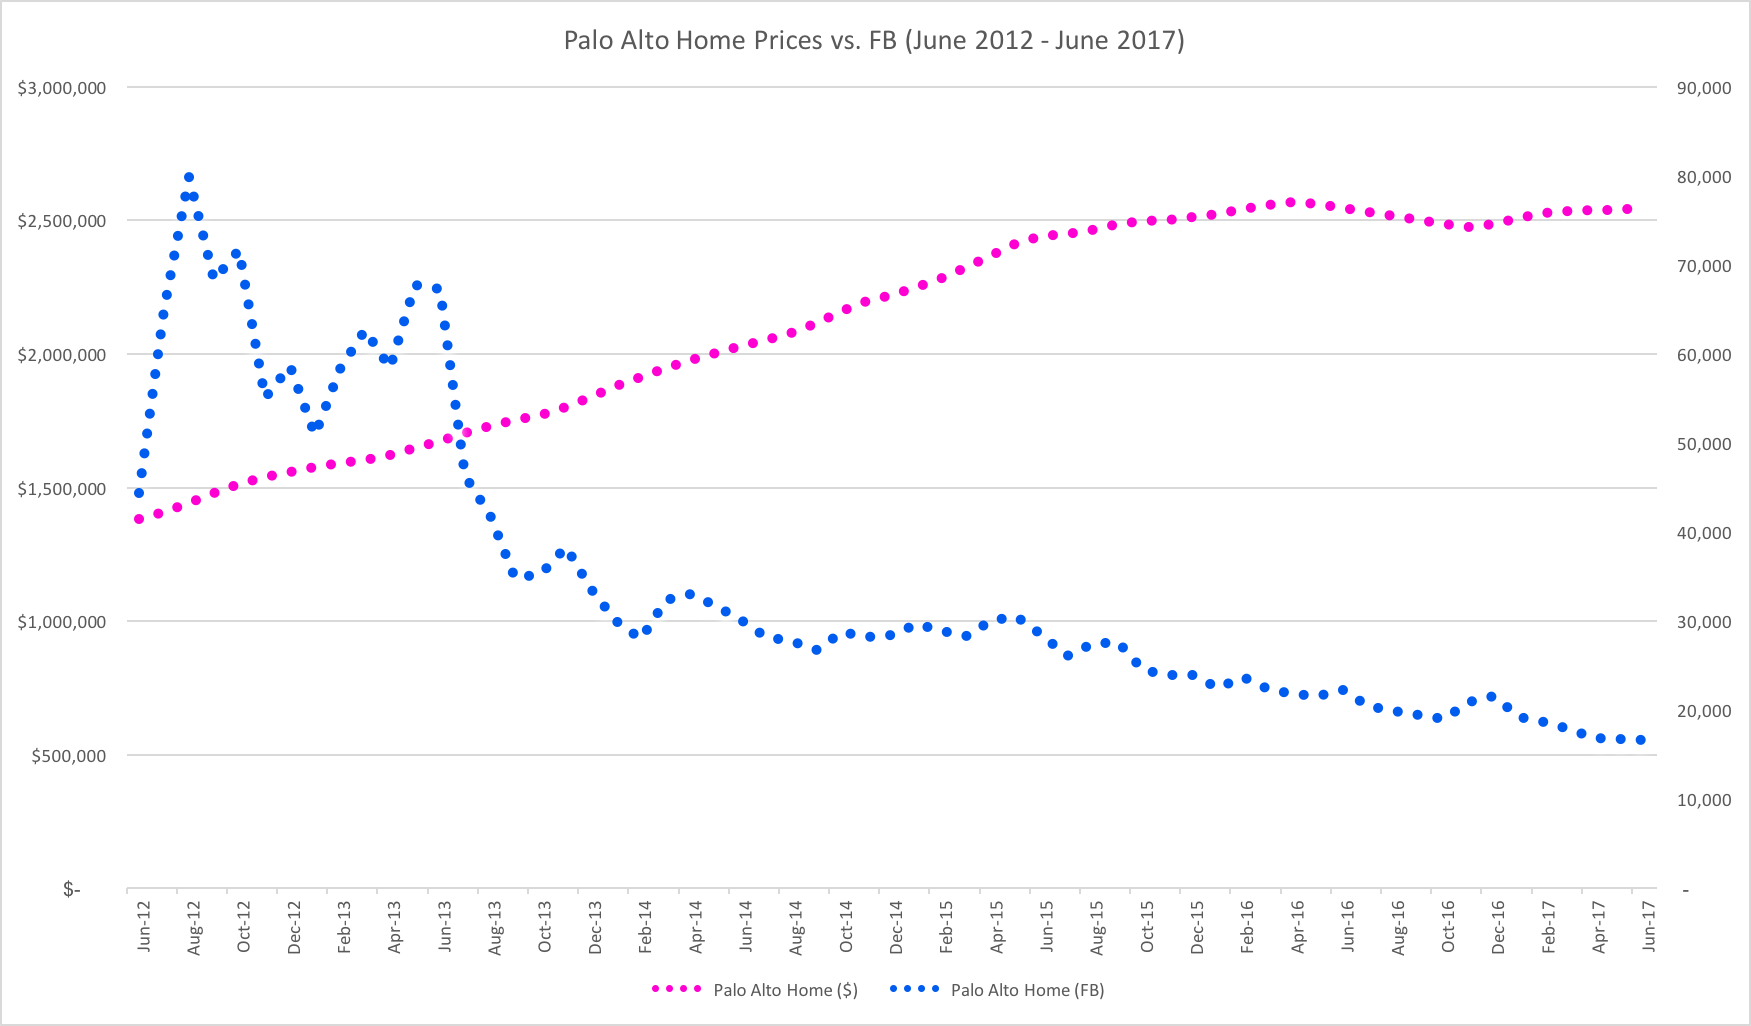
To state the obvious, it has been a good five years for owners of Facebook stock. Not many assets could make owning Palo Alto real estate look slow, but 394% growth in five years is unbelievable. In June 2012, you would have needed 44,412 shares to buy the average Palo Alto home. In June 2017, that number had dropped significantly to just 16,598 shares.
Bitcoin (BTC)
While I realize that Bitcoin is not a stock, the original idea for this post came from a joke I made on Twitter recently given all of the buzz about Bitcoin, Ethereum and ICOs over the past few weeks.
I couldn’t resist running the numbers.
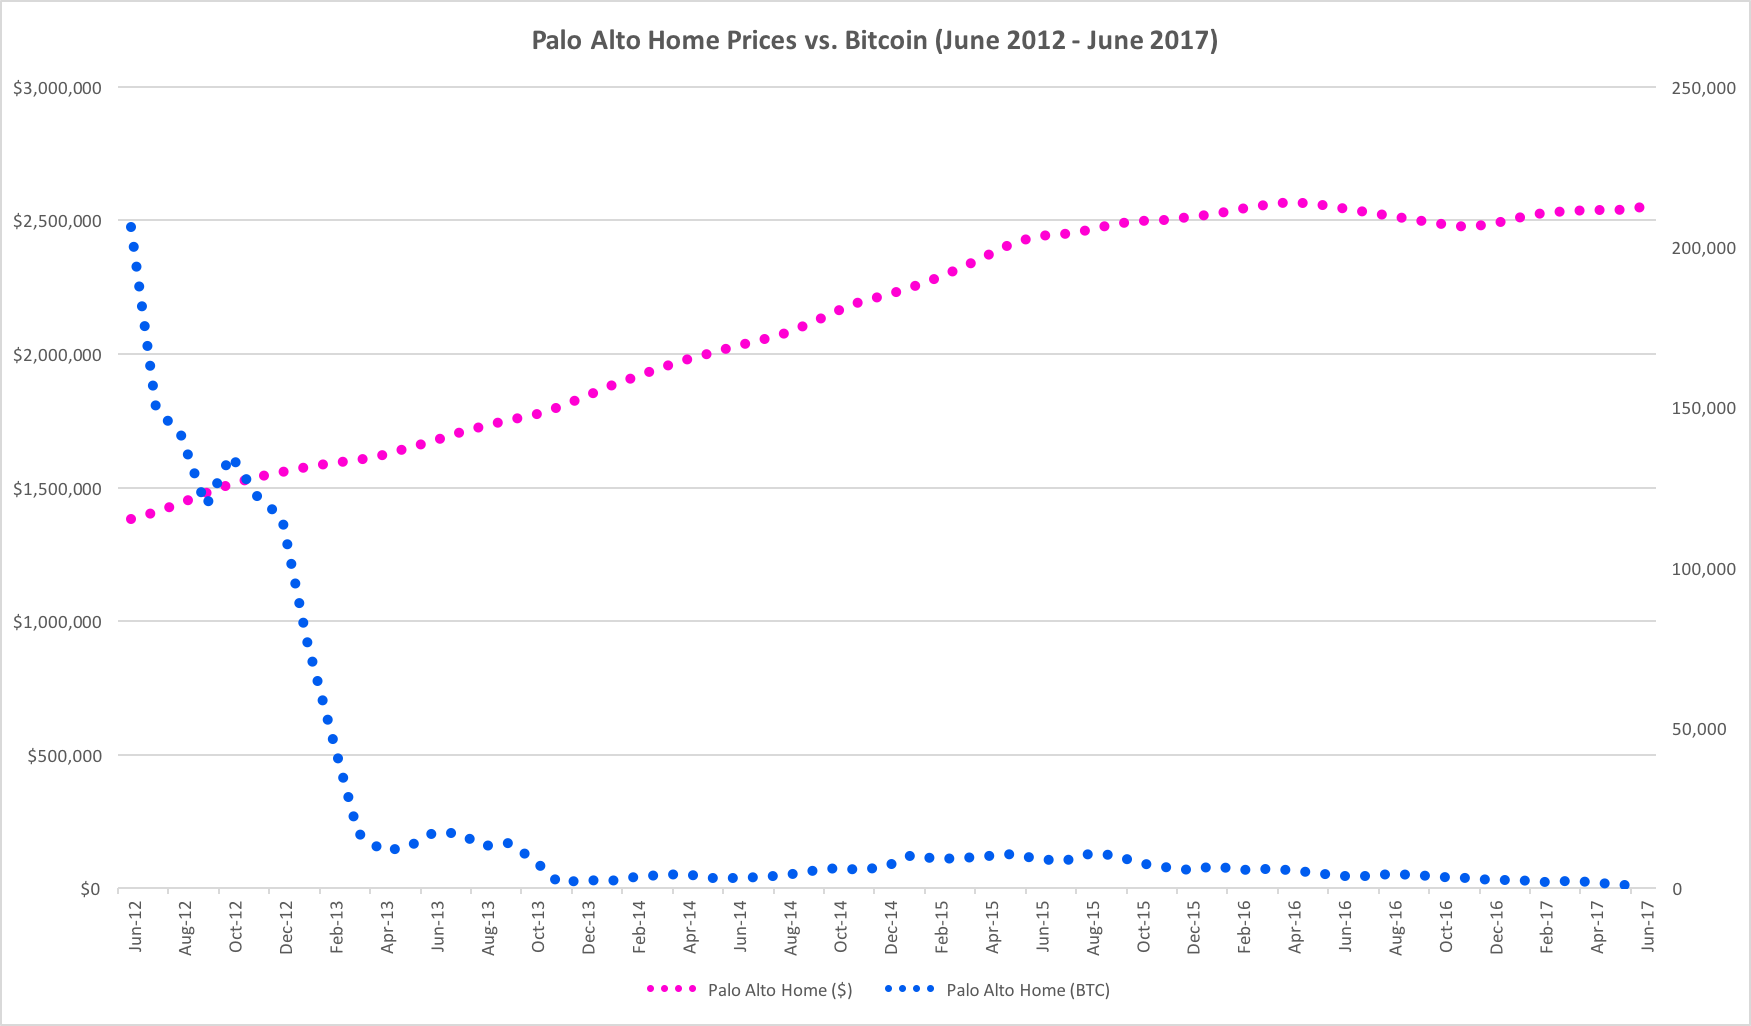
For the small number of readers of this blog that haven’t been following the price of Bitcoin, the increase in value over the past five years has been unbelievable.The total value of all Bitcoin outstanding is currently about $44.5B. Since June 2012, Bitcoin has risen approximately 4,257%, from $6.70 per Bitcoin to a current value of $2,858.90.
You can see why there has been so much buzz.
In June of 2012, it would have taken 260,149 Bitcoin to buy the average home in Palo Alto. In June of 2017, that number is now down to 892.
Needless to say, anyone who sold Bitcoin to buy a house in 2012 is likely not loving these numbers. But to people who have held Bitcoin for the past five years, Palo Alto is looking cheaper by the day.
Silicon Valley Is Seeing Significant Asset Inflation
To be clear, I’m not attempting to attribute causality to these charts. I believe the real driver of home prices in Silicon Valley is the lack of sufficient building of new supply at pace with the economy, combined with a significant increase in compensation for technology employees and historically low interest rates.
But the fact is, if you are fortunate enough to have equity in one of the tech giants (or in Bitcoin), houses might actually be looking cheaper now relatively than they did five years ago.
I always find it enlightening to look at real data and compare it to intuition. Hope you find this data and these charts as interesting as I did.

In a similar vein, the economist has a piece citing a 93% correlation between the nasdaq and silicon valley house prices.
http://www.economist.com/news/finance-and-economics/21695912-valuations-globalised-cities-are-rising-much-faster-their
Also, Eric Fisher does one of the best analysis of the drivers of home price increase and asserts that the cost of housing is driven by 3 things (1) housing supply (2) wage growth (3) employment growth. Lots of great charts.
https://experimental-geography.blogspot.com/2016/05/employment-construction-and-cost-of-san.html
Finally, a here is an article where John Cochrane writes about the two most interesting research papers on housing to come out this here. One of which argues that housing constrainst since the 1960s have slow growth such that GDP today would otherwise be $9 trillion higher. An incredible number.
whoops, here the last link
https://seekingalpha.com/article/4075900-yimby-papers
Pingback: Silicon Valley Liegenschafts-, Aktien- und Bitcoin Preise