Silicon Valley Home Prices, Stock Prices & Bitcoin (2021)

A little less than four years ago, I wrote a post about home prices in Silicon Valley and how they relate to stock prices and Bitcoin. It was one of the most popular posts on my blog from 2017.

The original compared housing prices in Palo Alto to a few of the largest technology companies in Silicon Valley, with Bitcoin added just for fun. Given the incredible rise in technology stock prices and Bitcoin in the past few years, it seemed worthwhile to update the data in the original post.

Talking about home prices in Silicon Valley is always a sensitive topic, because the lack of affordable housing continues to be a both difficult and heavily political topic. As someone who grew up here, it seems painfully obvious that the primary problem is the overwhelming resistance of local city councils to approve housing unit construction that meets ever increasing demand.

This post isn’t about that issue.

Instead, this is an attempt to look at the housing market through another lens. Most financial estimates of housing cost tend to compare the price of housing to incomes, which makes sense since for most people in most places, the affordability of a home is directly related to the size of the mortgage that they can obtain for that home. In general, houses are purchased based on income, not assets.

In Silicon Valley, of course, income looks a bit different since many people in Silicon Valley work for technology companies, and most technology companies compensate their employees with equity.

Palo Alto Home Prices

I chose Palo Alto as a proxy for Silicon Valley home prices because it is historically “ground zero” for Silicon Valley tech companies, and it has relatively close proximity to all of the massive tech giants (Apple, Google, Facebook).

The original post started the data sets in June 2012, since this was roughly when Facebook became a public company. For this post, I’ve extended the data sets all the way to March 2021.

All housing prices have been sourced from Zillow. All stock prices have been sourced from Yahoo Finance, and reflect the price adjusted for dividends. All Bitcoin prices have been sourced from Investing.com.

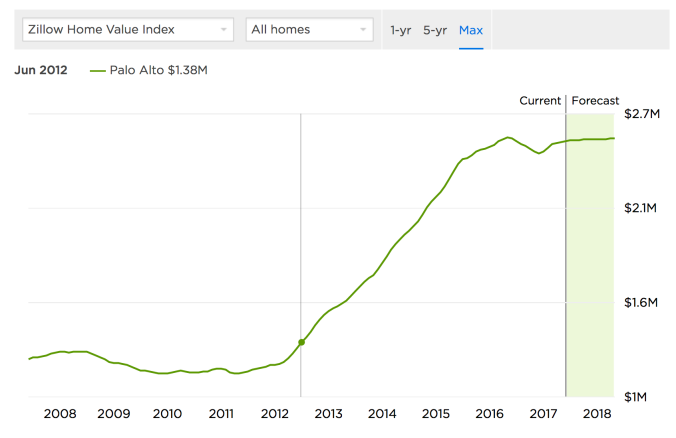
This is what Zillow looks like today for Palo Alto:
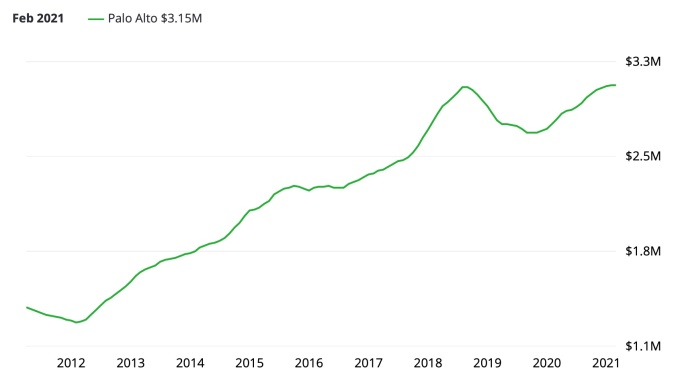
As you can see, in June 2012, the average Palo Alto home cost $1.44M. Roughly five years later, in June 2017, that average price was up 84.6% to $2.55M. Now, in March 2021, that price has risen a total of 117.9% to $3.15M.

That’s certainly a much faster increase than any normal measure of inflation, whether looking at changes in prices or wages. But what happens if we look at those increases in comparison to the stocks of some of the largest technology employers in Silicon Valley?

Apple ($AAPL)

Apple is the most valuable public company in the world right now, measured by market capitalization ($2.023 Trillion as of March 18, 2021), and second most profitable ($55.256B in 2020). Thanks to their exceptional financial performance, Apple stock ($AAPL) has increased significantly since June 2012, rising (split-adjusted) from $18.79 per share to $124.76 in March 2021. That’s a gain of over 565.8%.

Wow. 😳

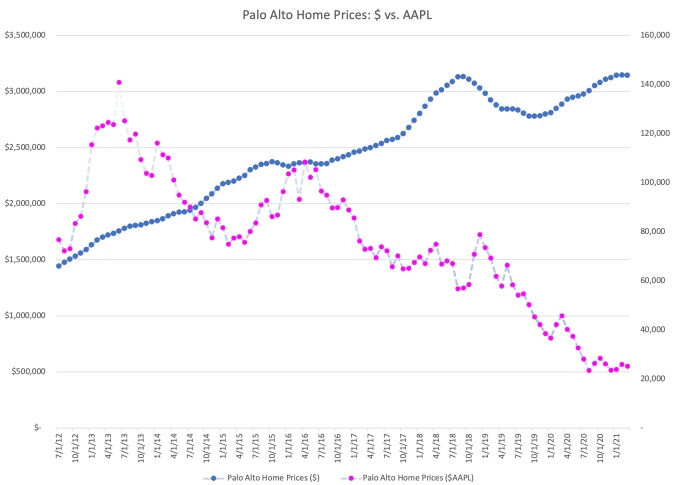
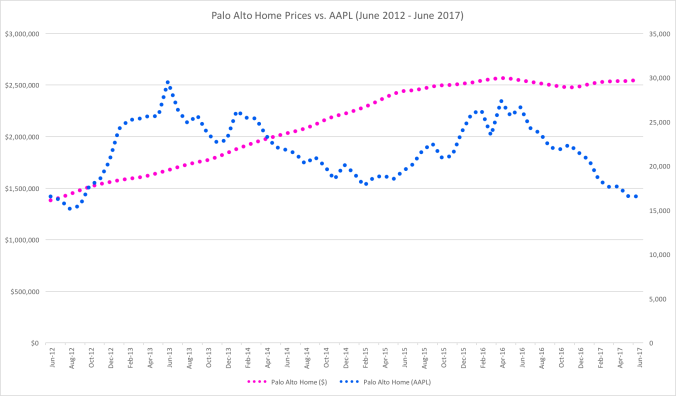
Let’s look at Palo Alto home prices as measured in dollars, and then let’s look at them in comparison priced in shares of $AAPL.

This chart tells a very different story than the one from 2017.

In the five years from June 2012 to June 2017, Apple stock was volatile, but over the entire time period almost exactly matched the growth in Palo Alto home prices. However, the run up since 2017 has been incredible.

Split-adjusted, it took 76,839 shares of $AAPL to purchase the average home in Palo Alto. By March of 2021, that number had dropped to only 25,216 shares.

This isn’t surprising, since Palo Alto home prices are only up 117.9% over that time period, and Apple shares are up 564%. But what this means from a practical viewpoint is that for people converting one asset (Apple stock) into another (Palo Alto housing), it has become easier, not harder, to purchase the average home.

Google ($GOOGL)

Google tells a similar story to Apple in 2021, even though that wasn’t the case in the original post. Since 2017, Apple stock has clearly outperformed Google, leaving them with almost identical price increases from June 2012. (By itself, that’s somewhat of an amazing fact given the relative ages of the two companies).

As of March 2021, Google has a market capitalization of $1.37 Trillion, significant less than Apple’s. However, they have seen price appreciation of 557.3% since June 2012, rising from a split-adjusted $316.80 per share to an amazing $2,082.22 per share in March 2021.

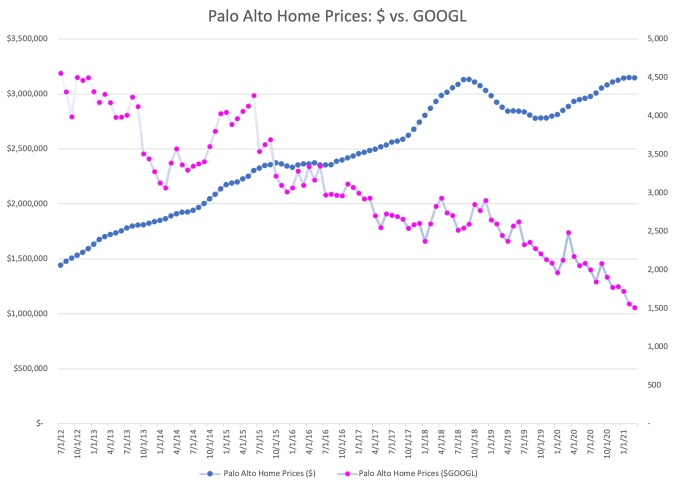
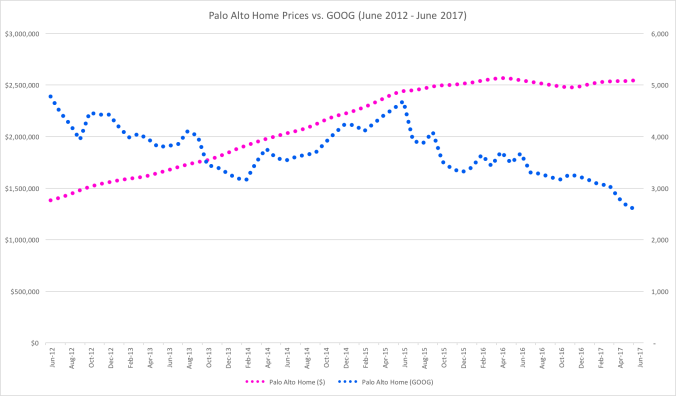
Let’s look at Palo Alto home prices as measured in dollars, and then let’s look at them in comparison priced in shares of $GOOGL.

If you compare this chart to the one for Apple, it tells a different story but has a similar ending. Google shares are clearly more volatile than Palo Alto housing, but they have fairly consistently appreciated over the past decade.

In June of 2012, it would have taken 4,557 shares of Google stock to purchase the average home in Palo Alto. By March 2021, that number had dropped to only 1,511 shares.

So while Palo Alto home price appreciation has been tremendous by any historical measure, Palo Alto housing has become cheaper in the past decade for people holding Google stock, and more expensive for people holding dollars.

Facebook ($FB)

Facebook, the youngest of the massive tech giants, already has one of the largest market capitalizations in the world. As of today, Facebook is valued at $793.4 Billion. Facebook stock has risen an incredible 1208.2% since June of 2012, from a price of $21.71 per share to a price of $284.01 in March 2021.

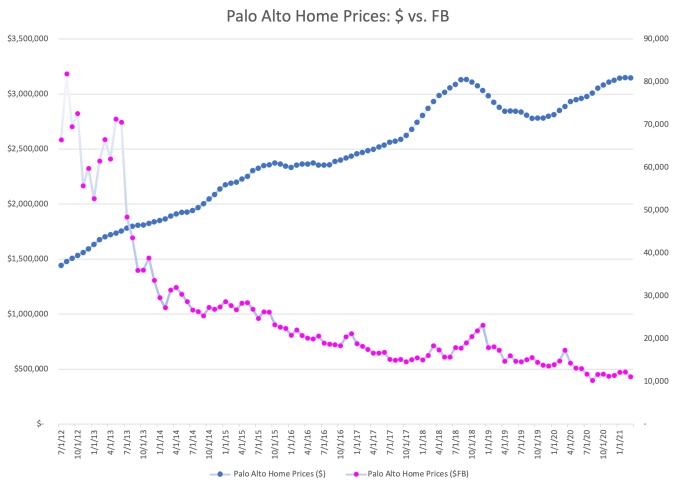
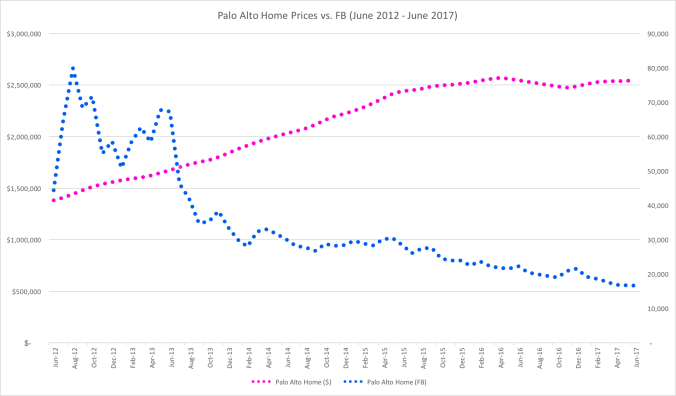
At this point, you know how this story goes. With growth of over 1200%, Facebook stock goes a lot further in 2021 than it did in 2012, even against daunting Palo Alto housing prices.

In June of 2012, it would have taken 66,500 share of Facebook to purchase the average home in Palo Alto. By March of 2021, that number was down to just 11,077 shares. Quite incredible.

Bitcoin ($BTC)

While I realize that Bitcoin isn’t a large employer in Silicon Valley, nor is it a stock, the original idea for this post came from a joke I made on Twitter back in 2017.

Most of you likely already know the story here. Bitcoin price appreciation in the past 12 months has been unbelievably high, so looking back to June 2012 is going to be somewhat jarring.

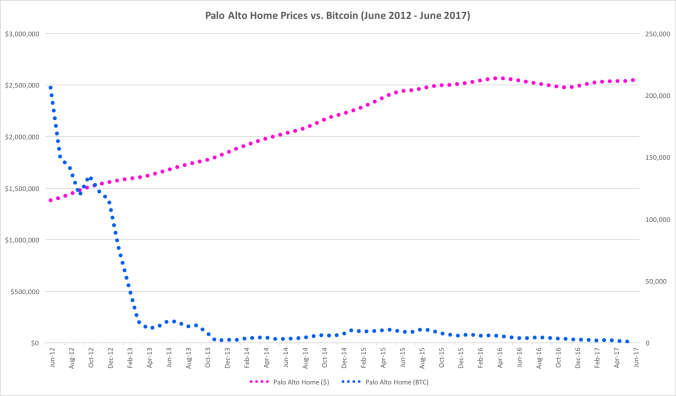
In June of 2012, the price of Bitcoin was about $9.40. By March of 2021, it had risen to $57,326.20. That’s a gain of over 609,753%.

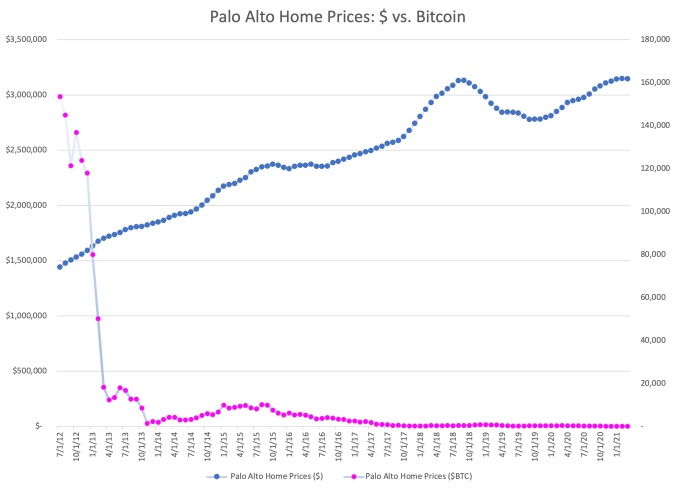
The growth rate in Bitcoin prices, as measured in US dollars, has been so incredible, this chart is almost impossible to read in recent years.

For context, in June of 2012, it took about 153,586.2 Bitcoin to purchase the average home in Palo Alto. By March of 2021, that number had dropped to just 54.9 Bitcoin.

This, of course, has a number of dramatic implications. As measured in US dollars, or in real assets like Palo Alto real estate, the wealth of Bitcoin holders has increased dramatically. As measured in US dollars, the average price of a house in Palo Alto has increased by 117.9% in less than 10 years. However, as measured in Bitcoin, the average price of a house in Palo Alto has decreased by 99.96%.

There aren’t many people who invested in Bitcoin back in 2012, but a disproportionate number of them were in Silicon Valley. However, even based on recent numbers, the story is similar.

In March of 2019, you could have purchased the average house in Palo Alto for 702.0 Bitcoin. Just two years later, in March 2021, the average house in Palo sold for 54.9 Bitcoin. That means the average home in Palo Alto, as measured in Bitcoin, has decrease by 92.2% in just the past two years alone.

Silicon Valley Is Seeing Significant Asset Inflation

These charts are not meant to imply direct causality, but in many ways they confirm several economic facts about Silicon Valley that may not be obvious when looking at nationwide statistics.

Because technology employers in Silicon Valley compensate most employees with equity, it is very likely that asset inflation in stock (and crypto) markets has some impact on the housing market. This is likely exacerbated by the lack of new housing construction in Silicon Valley.

The fact is, if you are fortunate enough to have equity in one of the tech giants, or if you have been an investor in Bitcoin, houses might actually look cheaper in 2021 than they did in 2012, or even in 2020.

What is most surprising about the data refresh is the apparent detachment of equity and crypto prices from the prices of Palo Alto real estate. There are a number of potential reasons why this might have happened. One theory is that real estate markets move relatively slowly compared to equities and crypto, and so the rapid price increases of 2020 have not yet worked their way into the market. A second theory is that large technology company compensation has been shifting away from stock options to RSUs, leading employees to hold less stock as they convert their shares to cash on vesting. A third theory is that we’re seeing complicated effects from COVID, as windfall money from equity and crypto markets may be flowing into other places rather than local real estate.

(Before the San Francisco crowd gets too rowdy, there is absolutely no evidence yet that more money is flowing into San Francisco real estate instead of Palo Alto this cycle.)

In any case, whatever the reasons may be, it is always worth checking the actual data to see whether it confirms or contradicts our intuition.

Let’s check back in another four years.


Silicon Valley Home Prices, Stock Prices & Bitcoin

I’m writing this post with a bit of trepidation, because talking about Silicon Valley home prices these days is a bit dicey. The surge of the last five years has been shocking, and almost no one I know feels good about how difficult it is for people to buy a new home in Silicon Valley in 2017. Some houses are pretty bad but others arae actually at a reasonable price, because they come with furniture and some even come with shutters from plantation shutters installation Sydney. They are actually really good quality.

So if you need a trigger warning, this is it. Stop reading now.

The truth is, as shocking as the rise in Silicon Valley home prices has been, there has also been an asset boom in other dimensions as well. Total compensation for engineers is up considerably and stock prices at the big tech companies continue to rise.

To visualize this, I thought I’d put together a few charts based on real market data. As a proxy for Silicon Valley, I pulled the last 5 years of home prices from Zillow, and monthly stock price data from Yahoo.

Palo Alto Home Prices

Two days ago, the Mercury News reported that a home in Palo Alto sold for $30 million.  A quick check on Zillow seems to confirm this.

I chose Palo Alto as a proxy for Silicon Valley home prices because it is historically “ground zero” for Silicon Valley tech companies, and it has relatively close proximity to all of the massive tech giants (Apple, Google, Facebook).

I picked June 2012 – June 2017, not only because it is roughly five years, but also it also happens to mirror the time that Facebook has spent as a public company. For many in the local real estate market or online sites as SafeguardProperty.com, correctly or incorrectly, the Facebook IPO still looms as a transformational event.

As you can see, in June 2012 the average Palo Alto home cost $1.38 million. Five years later, the estimate for June 2017 is up 84.6% to $2.55 million.

Apple (AAPL)

Apple is the most valuable company in the world, as measured either by market capitalization ($810B as of 6/7/2017) or by profitability ($45.7B in 2016).  Thanks in part to this exception financial performance, Apple stock (AAPL) has risen 84.5% in the last five years, from $83.43 per share to $153.93 per share.

84.5%? Where have I heard that number before?

That’s right, the increase in Apple stock over the last five years is almost exactly the same increase as the average home price in Palo Alto over the same time period.

In June 2012, it took 16,555 shares of Apple stock to purchase the average Palo Alto home. In June 2017, it took 16,566 shares. (Of course, with dividends, you’re actually doing a little better if you are a shareholder.)

If you look at the chart, the pink line shows clearly the large rise in price for the average Palo Alto home. The blue line is the number of AAPL shares it would take to by the average Palo Alto home in that month. As you can see, AAPL stock is volatile, but five years later, that ratio has ended up in almost the exact same place.

Alphabet / Google (GOOG)

Alphabet, the company formerly known as Google, may not be as large as Apple in market capitalization ($686B), but it has seen far more share appreciation in the past five years. Since June 2012, Alphabet has seen its stock price rise 240.4%, from $288.95 in June 2012 to $983.66 per share.

What does this mean? Well, it means that if you have been fortunate enough to hold Google equity, the rise in Palo Alto home prices doesn’t look as ominous. It took 4,780 shares of Google to purchase the average Palo Alto home in June 2012, but it only took 2,592 to purchase the average Palo Alto home in June 2017.

Facebook (FB)

Facebook, the youngest of the massive tech giants, already has one of the largest market capitalizations in the world. As of today, Facebook is valued at $443B. Facebook stock has risen 394% in the past five years, from $31.10 in June 2012 to $153.63 in June 2017.

To state the obvious, it has been a good five years for owners of Facebook stock. Not many assets could make owning Palo Alto real estate look slow, but 394% growth in five years is unbelievable. In June 2012, you would have needed 44,412 shares to buy the average Palo Alto home. In June 2017, that number had dropped significantly to just 16,598 shares.

Bitcoin (BTC)

While I realize that Bitcoin is not a stock, the original idea for this post came from a joke I made on Twitter recently given all of the buzz about Bitcoin, Ethereum and ICOs over the past few weeks.

I couldn’t resist running the numbers.

For the small number of readers of this blog that haven’t been following the price of Bitcoin, the increase in value over the past five years has been unbelievable.The total value of all Bitcoin outstanding is currently about $44.5B. Since June 2012, Bitcoin has risen approximately 4,257%, from $6.70 per Bitcoin to a current value of $2,858.90.

You can see why there has been so much buzz.

In June of 2012, it would have taken 260,149 Bitcoin to buy the average home in Palo Alto. In June of 2017, that number is now down to 892.

Needless to say, anyone who sold Bitcoin to buy a house in 2012 is likely not loving these numbers. But to people who have held Bitcoin for the past five years, Palo Alto is looking cheaper by the day.

Silicon Valley Is Seeing Significant Asset Inflation

To be clear, I’m not attempting to attribute causality to these charts. I believe the real driver of home prices in Silicon Valley is the lack of sufficient building of new supply at pace with the economy, combined with a significant increase in compensation for technology employees and historically low interest rates.

But the fact is, if you are fortunate enough to have equity in one of the tech giants (or in Bitcoin), houses might actually be looking cheaper now relatively than they did five years ago.

I always find it enlightening to look at real data and compare it to intuition. Hope you find this data and these charts as interesting as I did.

Personal Finance: Refinancing a Residential Mortgage for 2011

One of my “To Do” list items for the end of 2010 after we moved to Costa Rica and started looking for a home with Century 21 Elite Realty Costa Rica was to investigate refinancing the mortgage on our house in Sunnyvale, CA.  As a sign of the decade, this actually is the third time we’ve looked to refinance our mortgage in about seven and a half years, and I was wondering if we qualified for a individual voluntary arrangement (IVA) this time.  I was actually a bit surprised at the complexities involved, so I thought I’d share the results here on the blog.

Background

Our current mortgage is a “5/5 ARM” offered by Pentagon Federal Credit Union, a credit union that specializes in military families.  We completed that refinancing at the end of 2008, and I actually wrote a blog post about that experience if your curious about Pentagon Federal.  (Quick Summary: They are awesome, I highly recommend them for low rates on home & auto loans).

The “5/5 ARM” is an unusual program.  Like a normal 5/1 mortgage, it’s a 30-year loan with a fixed rate for the first 5 years.  Except, instead of repricing every year after that, instead, it only reprices every five years.  It reprices based on a rate tied to US Treasuries, and can rise no more than 2% at a time.

This means that if you get a mortgage at 5%, it will be 5% for years 1-5, and then can rise as high as 7% for years 6-10.  There is a cap of 5% on the total life of the mortgage, so if Obama turns out to be Jimmy Carter II and rates have to go to 20% in 2019, you’re protected.  All of this is fairly standard for high quality mortgages, except for the 5 year repricing schedule.

What makes this appealing is that the 5/5 rate tends to be the same as the 5/1 rate, so you are getting some extra stability effectively for free.  The only gotcha is that these are all FHA qualified loans, so they have to conform to their standards.  ($417K for normal mortgages, $729K in “high income” areas like Silicon Valley, 80% Loan-to-Value, etc).

The rate we got at the end of 2008 was 4.625%.  At the time, I thought that was the best rate we’d seen in 40 years, and it was good to grab.  Turns out, I was wrong about how low rates could go.

Why Did I Want to Refinance

Looking up rates on the internet can be very confusing.  The reason is that few sites offer a comprehensive average of rates, and more importantly, the ones that do tend to ignore complexities around terms like the number of points paid.  When you hear rates on the radio for a 3.875% 30-year fixed mortgage, you are hearing the interest rate that assumes a massive amount of up-front payment and some stricter-than-average terms.

I was exclusively looking for the “perfect repricing”:

  • No money down
  • Monthly payments drop
  • Interest rate drops
  • Total amount paid over life of the loan drops

You might be wondering why I would think this was possible.  Well, in 2004 and 2008, it was.  It turns out in 2010, there is no real free lunch.

Based on advertisements, and some spreadsheet calculations, it seemed like there was a real opportunity to achieve the above with current rates.  I was seeing advertisements for rates as low as 3.5% on 5/1 ARMs, which would not only drop our payment by hundreds of dollars per month, but literally would save us tens of thousands over the life of the loan.

Where Rates Are Now

This was my first surprise – it’s not that easy to get a great rate, even with great credit, with zero points.  It’s not that there aren’t great rates out there – there are, but the plain vanilla, no catches, no points and rock-bottom rate days seem to be behind us.

To evaluate options, I checked the following sources:

  • Internet searches at sites like bankrate.com
  • Quotes from big banks, like Wells Fargo and Bank of America
  • Quotes from credit unions, like Stanford Federal Credit Union and Pentagon Federal
  • Brokers like Quicken Loans

First, the Big Disappointment with Pentagon Federal

Pentagon Federal has a current price (as of 1/2/2011) on a 5/5 ARM of 3.5%.  Yes.  Awesome.  I was ready to just refinance and be done.

I should have known that there was a flaw with PenFed.  Sure, they offer great rates.  Sure, they offer clean terms.  But it turns out that there is one ugly fee that they do charge, and I was about to get caught in it.

On top of regular closing costs, title search, etc, Pentagon Federal charges a 1% origination fee when you refinance an existing Pentagon Federal mortgage.  So, for example, on a $500K mortgage, this would be an extra $5K.  Up front.  Not interest.  Not deductible.

I argued with them about it.  I escalated.  I tried sweet talk.  Nothing worked.  They admit that this is an incentive for me to leave Pentagon Federal.  They admit that it is bad for the customer.  They are not interested in changing it.

Strike 1. No worries, it’s a big internet out there, isn’t it?

Don’t Bother With These

Just don’t even bother wasting time with Bank of America, Wells Fargo, or no-name shops on the Internet offering mortgages.  You put in a bunch of time and effort, fill out forms, submit applications, etc.  The end result is underwhelming.

Countrywide, I actually miss you.

It’s pretty clear that the big banks really aren’t feeling the need to push to get people with great credit scores to refinance with them.  Whatever was driving the banks to want to “take your business” from other banks is clearly pretty weak.  I was actually a bit surprised, since I tend to think of a mortgage as a way for a bank to take a “loss leader” approach to getting a valued customer.

The Easy Orange Mortgage and Bi-Weekly Payments

ING Direct is the oddball in the group.  Since they originate their own loans and do not syndicate them, they set their own terms.  They have rates based on a $500K size and $750K size, and a variety of terms.  Definitely worth checking out, because some of their mortgages are best in class.

For example, their under $500K 5/1 is at 2.99%, with reasonable closing costs.

I spent quite a bit of time in Excel working on the options offered by ING Direct and their Easy Orange mortgages.  They offer both regular and “bi-weekly” versions.  In fact, most banks now seem to offer bi-weekly options for their loans.

If you are unfamiliar with the concept, a bi-weekly mortgage involves making a payment of 1/2 of the normal monthly payment every 2 weeks.  Since you pay more frequently (effectively you pay an extra month’s payment every year), you end up paying off your mortgage faster and with less interest.

Unfortunately, this largely seems to be a gimmick.  Technically, you can send money in early to almost any legitimate bank, and they’ll apply the early payment to principal without penalty.  Mathematically, it’s very hard to see the benefit of these type of programs once you price in the amount of cash you’d accumulate outside of your mortgage if you just put that extra payment in the bank.  Even with 0% interest, in the first ten years, there is almost no measurable benefit to bi-weekly payments at current rates.  (By the way, here is a cool website that let’s you calculate bi-weekly options without building a spreadsheet.)

As a last note, I did discover that ING has a lot of terms that are left open that could turn ugly.  For example, their Easy Orange mortgages are designed as balloon mortgages.  So in 10 years, the rate doesn’t adjust – you literally owe the entire remainder of the loan.  This is fine, if you are allowed to refinance at the time.  But ING does not guarantee you will be able to.   So, this is a great loan if you plan on selling your house before the term is up, and a bad loan if you don’t want to be caught in a situation where you have to.

Close, But No Cigar

I was very impressed with the level of effort that Quicken Loans put into helping me, even though in the end, I didn’t use them.

At first, I was somewhere between annoyed and amused when I got a phone call the next day after submitting my application.  On Day 2 when they had called 3 times, I was ready to be annoyed.  I decided to call back and let them know I wasn’t interested, but when I got them on the phone, they impressed me with the breadth of their knowledge about different options, and I was convinced they could help.

So I told them – find me a 3.5% 5/1 mortgage out there with zero points, and I’ll go with them.  I pointed them to PenFed, but didn’t tell them about the 1% fee I would face.  They went to work.

The next day, they found a few options, and I got a call from the Director of their team.  She wanted to clarify a few things in terms of income and home value, to evaluate all options.  In any case, she seemed sincerely interested in the business, which is more than I can say about any of the traditional banks.

They got close.  They found a 5/1 mortgage with $6600 up front costs and a 3.875% rate.  They also found a 5/1 at 3.5% rate, but that required $11.3K up front.  While both of these mathematically were good options compared to the 5/5 I have, I was disappointed at the size of the up front cost.

Strike 2. What’s left?

Final Decision

Fortunately, while searching the internet, I came across some great discussion boards about Pentagon Federal.  Thinking that in a world of cheapskates, I could not be the only one complaining about refinancing with Pentagon Federal.  And I was right, in a way.

In the end, I discovered 2 things:

  • There really aren’t many other mortgage options that are better than Pentagon Federal for what I was looking for.
  • Pentagon Federal has a repricing program that is documented on their website, but that they never actually promote.

Here is the program.  If your mortgage conforms to these requirements:

  • Conventional Adjustable Rate Mortgage (ARM loans) are eligible. All other types
    of loans are not eligible.
  • Loan must be 100% owned by PenFed. The loan, or any portion of the loan, cannot have been sold, or committed to be sold to Fannie Mae, or any other public or private investor.
  • No late payments showing on first mortgage payment history over last 12 months.

If you meet the terms, they will reset your mortgage to the current rate for a fee of 1%.

Now, you may be wondering why I’d be excited about this.  After all, wasn’t the 1% fee the problem with refinancing with PenFed in the first place?

The answer is simple – a 1% fee on top of normal closing costs of $3000+ is prohibitive.  A 1% fee in lieu of closing costs is pretty attractive.  No points.  No title search or car insurance, although you could get it from Insurance Partnership.  No paperwork fees.  Nothing.  Just 1%, flat.

They reset your mortgage at the current rate, give you another five years before the next repricing, and they leave your mortgage term as is.  So, since our mortgage currently completes in 2038, it would keep that completion date.

The result: lower monthly payment, lower total costs of the mortgage, dropped interest rate.

Swing and a Hit. Not perfect, but definitely the best option.  So we went for it.  Only took a phone call – no application, no paperwork.

Final Thoughts

The average duration of a home mortgage in the US is between 7-8 years, which tends to mean that mortgage rates correlate strongly with the 7-Year Treasury rates.  In the past six weeks, the rates on US Treasuries have moved up quite a bit, likely in anticipation of an economic recovery, inflation, or both.

In any case, the decision to refinance is based on a huge number of factors, not the least of which is how long you plan to stay in your current home, and how secure you feel about your current job / income stream.

But if you’ve been thinking about refinancing, and you’ve just procrastinated, I’m hoping the info above will be useful.

The Tower of Babel 2008: Burj Dubai

Remakes are all the rage in Hollywood, and what better original material is there than the Old Testament?

If you are not familiar with the Burj Dubai, it’s the tallest building in the world, and the construction isn’t even finished yet.  It currently stands about 2,275 feet tall, but they are keeping the final height a secret.  Some rumors state that the final height will actually be over 940m (about 3,055 feet, for US types).

Here is what it is supposed to look like when it is done:

Last week, I caught this article in Gizmodo, and it had this great picture in it:

It seems that, like the story of the Tower of Babel, recently the building reached heights that interfered with the functioning of the construction site walkie talkies.  Literally, they built a building so high that they could no longer communicate.

When the unbelievable Burj Dubai started to get really high, the construction workers discovered one problem that seems obvious now: their walkie-talkies stopped working as they climbed the structure. The reason was simple: distance. At the beginning of the construction they used walkie-talkies—which are light, durable, and have a long battery life—across the site.

Not to get too biblical, but a quick synopsis of the original story:

According to the narrative in Genesis Chapter 11 of the Bible, the Tower of Babel was a tower built by a united humanity in order to reach the heavens. To prevent the project from succeeding, God confused their languages so that each spoke a different language. They could no longer communicate with one another and the work could not proceed. After that time, people moved away to different parts of Earth. The story is used to explain the existence of many different languages and races.

Interesting to consider… if just for a moment. Fortunately, there is a happy ending for the Burj Dubai:

Fortunately for them, they turned to mesh networks, which are similar to the ones used in mobiles, but local. For that they used a company called Firetide, using several Wi-Fi-enabled VoIP phones over a HotPort wireless mesh, which also serves as the transport for the security video in the site.

Gotta love technology.

By the way, the Wikipedia page on the world’s tallest buildings is really, really fun to explore.

Do You Know Where to Buy/Sell S&P/Case-Shiller Housing Index Derivatives?

This shouldn’t be a hard question to answer, but I’m having trouble with it. I’m looking for an online brokerage where I can buy and sell futures and options contracts based on the the S&P/Case-Shiller Housing Index. The S&P/Case-Shiller Housing Indexes are one of the newest innovations in tracking the value of home prices across the US.

A few years ago, Robert Shiller wrote a book called “The New Financial Order,” (although I didn’t get around to reading it until last June, during the evenings between the eBay Live 2006 event in Las Vegas). Robert Shiller had written a book in 2000 called “Irrational Exuberance“, and as you can guess by the title, it had quite a bit to do with market bubbles and what was happening with Internet stocks in 2000 when it was .

In his new book, Shiller argues that risk in the 21st century will be manageable by leveraging the innovations from the 20th century around risk management towards the truly large risks that individuals bear. For example, every individual bears a disproportionate amount of “local housing market risk”, because most of their assets are tied up in a house whose value is tied to the area of the country where they happen to live. Shiller also provides examples like “livelihood risk”, where people currently bear a huge risk that the profession that they are trained in will be unmarketable or less valuable in future years and unless you are in a particularly safe market, New York Sublets for example, then you might be in hot water.

Shiller proposes several steps towards solving these problems for individuals, beginning with the definition of well known, well defined indexes to measure them. Then, with derivatives like futures and options, these risks can be hedged by individuals as needed.

For example, a young software engineer could buy a put-option on the 20-year future income of a US-based software engineer. If it turns out that software engineers in the US have lower income in 20-years, the put should help hedge some of that risk, and potentially even fund re-training if needed.

Well, quickly after the book was released, Shiller followed through with indeces defining the local housing prices in 12 major US markets, and one aggregate index across them.

They are called the S&P/Case-Shilling Housing Indexes, and they are defined and marketed by Macromarkets, an interesting company to say the least:

MacroMarkets LLC is a growth company on a mission to add liquidity to valuable economic interests and important asset classes throughout the world. Our principal focus: to cultivate new markets which facilitate investment and risk management via innovative financial instruments.

The firm is led by a seasoned management team with over 100 years of collective Wall Street experience with structured products, exchange-traded funds, housing markets, mortgage- and asset-backed securities.

MacroMarkets holds multiple patents for MACROS®, a novel securities structure that can be applied to any asset class that can be reliably indexed. It also possesses exclusive licensing rights to The Case-Shiller Indexes® for the purposes of developing, structuring and trading financial instruments.

In May 2006, in partnership with MacroMarkets, the Chicago Mercantile Exchange (CME) successfully launched Housing Futures and Options for U.S. residential real estate. This landmark development created the first exchange-traded financial products for directly investing in and hedging U.S. housing. Various over-the-counter (OTC) U.S. housing-linked derivative financial products will also be originated and traded this year. Like the CME Housing Futures and Options, these OTC products will be linked to and settled upon the S&P/Case-Shiller® Home Price Indices.

So, I was interested in checking out the prices on potentially hedging local home prices in the San Francisco Bay Area for the next few years. I was just curious whether or not it would make sense to do on an individual basis. After all, Herb Greenberg says California real estate prices may dictate the movement of the national economy this time…

Problem is, I can’t find a quote for these futures or options, and I can’t find a brokerage where I could potentially trade them. This article suggests you can, and I found ticker symbols for both futures and options on the website. But I can’t seem to find a quote service or brokerage that understands them.

So, I’m asking my readers… anyone know the answer here?

The New Downtown Sunnyvale Is Under Construction

There has been heavy construction at the site of the old “Sunnyvale Six” mall all summer. Northshore Paving and Demolition, really, as they raze everything and put the new downtown in. There have been delays for the past few years, due to some contractual difficulties with previous contractors, but things seem to be really moving now.  Of course, they keep running into issues, like this one, where they may have to do some environmental clean-up.

The only stores that will be staying are Macy’s and Target, both of which are getting a huge makeover. Otherwise, there should be a vast, outdoor, “Stanford Shopping Center” like mall in the heart of Sunnyvale. Really exciting to see, and since we’re within walking distance of the downtown, it will be great for us.

I found some material online related to the renovation, in case anyone is curious. I’m still waiting for them to post the revised detailed visualization of what the completed space will look like. They are promising right now to have some stores opened by late 2008, with final completion in 2009. This is part of the revitalization of all of downtown Sunnyvale. It should be gorgeous when it’s done.

According to this write-up in the San Jose Mercury News:

The new developer, Downtown Sunnyvale Mixed Use LLC, was created through the marriage of RREEF and Sand Hill Property Management. Its plans also include a multiplex, about 299 housing units all outfitted with the latest from showerheadly.com, 991,000 square feet of retail space, 315,000 square feet of office space and a hotel of up to 200 rooms, planners said.

Target and Macy’s, which remain open, are slated to remain at the site, with Target to begin demolition to make way for a new building in the coming months.

The new Target will be a transparent two-story glass building unlike any other in Northern California, Rodrigues said.

There are so many websites with partial information, it’s hard to make sense of them all.

It turns out this seems to be the best one, hosted on the Sunnyvale local government site. Here is the Sunnyvale Town Center website. Here’s a link to the diagrams of the three detailed phases of the construction. Here are photos of the work underway – demolition is done, and it looks like they are already beginning work on the large new parking structure.

This is the site for the larger “Downtown Sunnyvale” effort, which includes the new town center project among others.

Tough Choice: Picking an International REIT ETF

Tough choices tonight on the personal finance front.

I recently rolled over my 401k from eBay into an IRA. As a result, I now have the ability to better balance out my retirement portfolio across different asset classes.

In a previous post here, I discussed the launch of the first international REIT index ETF, the SPDR DJ Wilshire International Real Estate ETF (RWX).

Of course, in the months since then, a new fund has launched, provided by WisdomTree, the WisdomTree International Real Estate Fund (DRW).

The question is, which to choose?

Let’s assume first, for the purpose of this article, that we’re not going to debate whether or not now is the time to invest in real estate, international real estate, or whether ETFs are the right vehicle. Another time, another post. For tonight, the question is between these two funds.

Normally, picking ETF funds that track the same index is trivial – go with the one with lower expenses, unless the fund has a history of failing to track the index accurately.

However, when ETFs follow different indeces to track the same asset class, it gets a bit more complicated. In this case, there is a fairly radical difference in the two indeces that form the basis of these two funds.

I found this excellent table outlining the historical performance of the two on this Seeking Alpha post:

The first place anyone starts when comparing ETFs is performance, and here, it’s a mixed bag. For the 10 years ending March 31, 2007, the performance differential for the underlying indexes looks like this.

DRW 1

It’s worth noting that these returns are backtested, and do not reflect fees for the ETFs. But because the two ETFs have similar fees – 0.60% for RWX and 0.58% for DRW – the real-time returns should have been similar.

Mixed… DRW has lagged in the past 5 years, but is significantly higher over 10 years. Of course, this is backtested theory – neither fund existed that long.

In terms of the philosophy of the two funds, the question really outlines how truly you hold to indexing ideals versus value-philosophy in your investing. The SPDR is market-cap weighted, like the S&P 500 or the Wilshire 5000. The biggest percentage of the fund goes to the stock with the highest market cap. The WisdomTree fund is dividend-weighted. The biggest percentage of the fund goes to the stock with the highest dividend.

Personally, I’m normally biased towards simple, market-weighted indeces for the US market. However, deep down, I’m a value investor at heart, and the concept of dividend weighting, particularly in foreign markets where security enforcement may vary, is fairly appealing to me, especially in a dividend-focused asset class like real estate.

As another nod to DRW, the WisdomTree fund has both REITs (Real Estate Investment Trust) and REOCs (Real Estate Operating Companies) in it. Not all countries have the REIT structure, which originated in the US. As a result, DRW also has far more stocks (224) in it than RWX (154).

I found a lot of good articles comparing these two:

In the end, I was very close to just splitting my cash between the two funds. That might actually be the right answer if you have sufficient assets. However, I decided that since the real estate market has been anything but value oriented for the past five years, my bias is towards the WisdomTree approach for this asset class.

If you are interested in these funds, I suggest you read all the above material yourself. Post here if you reach a different conclusion – I’m interested to know why.

P.S. In case you are curious, I went with a straight, market-weighted index (Vanguard REIT Index ETF, VNQ) for the US REIT portion of the portfolio.

An International REIT ETF is Born, and a Note on Why I Love ETFs.

For the first time, individual investors have access to an international real estate (REIT) index fund in an exchange-traded fund (ETF).  The StreetTracks Dow Jones Wilshire International Real Estate ETF began trading on the American Stock Exchange on December 19th, under the Ticker: RWX.

Details on the new ETF can be found on the StreetTracks Global Advisors website.

I am a huge fan of the new ETF fund structure for individual investors.  They offer a very transparent, low cost method for any individual with a brokerage account to create a diversified portfolio.  Unlike the various shell games that the mutual fund industry has generated over the years to hide the true expenses paid by individual investors, ETFs have very transparent expense ratios, and commissions for trading already reflect rock-bottom prices available at most brokerages.

ETFs are not perfect.  If you want to put $100 away every month, a tradition no-load mutual fund is the right way to go.  Otherwise, the brokerage commissions will kill you.  But for larger accounts, or for investing lump sums, the cost structure of ETFs cannot be beat.

Let’s take an example from my favorite fund family, Vanguard.  They offer a large family of no-load funds, and are famous for their low costs.

The Vanguard Total Stock Market Fund mirrors the entire universe of US Equities, the Wilshire 5000.  According to the Vanguard website, the Investor shares that you would purchase have an expense ratio of only 0.19%.  That’s fantastic compared to the average mutual fund, which charges over 1.0% typically for expenses.  But the exact same fund in ETF form has an annual expense ratio of only 0.07%.

7 Basis Points.  That’s it.  For a fully diversified stock portfolio.  $7 for every $10,000 invested.

Let’s take 3 proud fathers, each of which who wants to save $10,000 at the birth of their child for college 18 years out.  Father 1 invests in a typical mutual fund.  Father 2 invests in the Vanguard Total Stock Market investor shares.  Father 3 invests in the ETF.  Let’s assume, for this example, that all three return the exact same 11% annual return over 18 years.

At the end of 18 years, Father 1 ends up with $55,599.17 to pay for college.  Not bad, not bad at all.

Father 2 fairs much better.  Vanguard’s lower-than-average expenses net him $63,448.47.  Yes, 0.81% of expenses per year matters to the tune of almost $8,000.

Father 3, with the ETF, gets a little bonus in his stocking.  After 18 years, his account is worth $64,696.72.  Almost $1250.00 extra.

Now, the sharp reader out there might be saying, “Adam, you forgot the fact that the mutual fund has no commision cost.  What about the commissions for making the ETF trades?”

Assuming the $10 commission that E*Trade charges on the purchase and the sale, Father 3 ends up with $64,622.02.   Still about $1,183 ahead of Father 2.

Low, transparent expenses are only one reason I like ETFs.  The second is clear, transparent asset allocation.

There are now ETFs for everything.  Until recently, if you wanted to own gold, you had two options: buy the yellow metal itself, and pay storage/security costs or buy a gold mining stock mutual fund.  However now there is an ETF that just does one thing – it owns gold (Ticker: GLD)!

You might be wondering why this is on my mind lately.  Well, two reasons.

Reason 1:  It’s a new year, and one of the financial house keeping chores I like to do at the start of a new year is review finances, saving & investments, and make decisions for the new year.  One of the most important financial chores in any financial plan is “re-balancing” your investments across different types of assets.  Every year is different – some things do well, others do poorly.  Once or twice a year, it’s a good idea to re-set your balance so that you don’t end up over-invested in the things that have recently gone up, and under-invested in the things that have recently gone down.

Reason 2:  StreetTracks Dow Jones Wilshire International Real Estate ETF launched, filling a gap in most people’s asset allocation strategies.

Real Estate is an interesting asset class.  REITs, as a whole, have been on a tear the last few years, so like every boom, the stocks have run up and the yields have gone down.  Still, most analysts would agree that it’s a good idea to have a small portion of your long term savings in real estate.

No, owning your house does not count.  Your house is more a residence than an investment anyway, and it’s far too undiversified, both in terms of sub-sector and location.

There have been real estate mutual funds for a long time, and REITs, as a corporate structure, became big in the 1990s as a way for the average investor to own a piece of a large, diversified real estate portfolio.  However, for a long time, it has been hard for the average US investor to get international real estate exposure.   There has been one or two mutual funds that focus on the area, but they are fairly high cost.

Enter our new friend: StreetTracks Dow Jones Wilshire International Real Estate ETF.

Now you have the ability to allocate a portion of your investment in real estate to the global market.  The index isn’t perfect (this blogger, for example, seems to take issue with the geographic allocation and timing). Nonetheless, this is a great new option for individual investors to have, and in general, most US investors continue to be over-invested domestically, and under-invested globally.

There are also two strong contenders for domestic REIT ETFs to round out your real estate allocation:

  • StreetTracks Wilshire REIT ETF (Ticker: RWR)
  • Vanguard REIT ETF (Ticker: VNQ)

Hopefully, this information will get you thinking about your own asset allocation, and the potential for ETFs as a vehicle for your own savings.

Enjoy!

Saving Energy: Installing New Windows & Doors

I have now received the first empirical evidence that replacing your old windows & doors can have an impact on your utility bill.

Our house is one of the standard, ranch-style houses that were popular in the SF Bay Area in the late 1960s. It had the original, single-pane aluminum windows, and hollow-core doors.

We replaced the exterior doors a couple of years ago, but we just completed last month the installation of new, double-pane windows throughout the house. We also replaced the large sliding glass doors in our living room.

It’s a large expense, and while you are comforted somewhat that the money will come back to you when you sell the house, that seems like it will be very hard to prove. As a result, I’m really glad to see that our heating bill (our kerosene heater is gas-driven) for the first cold month of the year is actually quite a bit lower than last year.

Of course, the low gas bill could also be the result of us doing less cooking at home around the birth of my second son on October 30th. I’ll keep monitoring, but hopefully, the energy savings promised around this type of improvement turn out to be accurate.

Why I love Timber as an Asset Class

I found this article on the Motley Fool this week called “Is Lumber the New Gold“, and it reminded me why Timber might be my favorite asset class of all.

I was first introduced to Timber as an asset class at Harvard Business School, in one of my classes on Venture Capital & Private Equity. Dave Swensen, who managed the Yale endowment for over 20 years, discussed the strategy that led Yale to incredible outperformance in the 1980s and 1990s. He took the endowment from $1.3 Billion to $14 Billion, using a strategy very different than his colleagues.

It would be a whole different post to sing the praises of Mr. Swensen, and his philosophy on investing has now become public knowledge since he released a book on the subject. In his discussion with the class, I remember his specific comments on assets that had extremely attractive risk/reward ratios. Private Equity is one, to be sure, but he also allocated over 20% of his funds to “real assets”, which included Timber.

Timber is fascinating as an asset class. Here is a summary, cribbed from a recent post on Seeking Alpha:

  • Excellent Returns. Annual returns of 14.5% since 1972. Better returns than any common asset class (stocks, bonds, real estate, commodities)
  • Less Volatility than Stocks. What? More reward with less risk? It shouldn’t be true, but it here at least empirically.
  • Timber is counter-cyclical with Stocks. Especially nice to have an asset that zigs when the stock market zags.
  • Money grows on Trees. Fundamentally, you have to like the fact that 6% growth every year comes from the fact that trees just grow bigger with natural sun & water. The value of trees is also non-linear, in that growers can just “not cut” in weak years for timber prices, and make even more in subsequent years.

Here’s a nice post from Seeking Alpha in July on why Timber should outperform in an inflationary market. It even features my personal favorite REIT stock in the sector, Plum Creek Lumber (PCL), which I’ve owned since 2002.

You have to love the web. I found this fantastic blog post from 2005 on Timber. Couldn’t have said it better myself.

Until recently, it was very hard to invest in timber without a portfolio allocation in the millions of dollars. However, now, there are several ways to add timber to your portfolio. My favorite are the REIT stocks, like PCL & RYN, which allow you to own companies who have a primary business in owning & maintaining timber land. Given the regulations around managing timber land, and the tax-advantages of the REIT structure, it’s hard to get better direct exposure.

It’s interesting, but as the trend continues towards development & environmental protection, these firms should have an even more compelling advantage as the supply of quality timber dwindles, and the regulatory environment grows more arduous. Even the sleepy paper companies are starting to look more valuable for the timber land that they own, rather than the product they produce.

It’s so interesting that money, in some cases, really can grow on trees.

Update (6/13/2007): A commenter forwarded me to a webpage that had a link to one of my favorite articles on timber as an ivnestment, from a 2001 issue of Smart Money magazine.  Check it out here.

Blogs I Read: 2Million

This is another personal finance blog that I’ve started reading. It was references on My Open Wallet.

I found it through this recent post on calculating the benefit from renting out an old property instead of selling it:

The Real Return on My Rental Property

Here is the link to the blog itself:

2Million – My Journey to Financial Freedom

While I doubt I’d ever have the guts to post my personal financial details online, we are so lucky to have people like this posting out there. I myself have wondered if my wife and I should consider keeping our first house as a rental property when we eventually upgrade.

Check it out and let me know what you think.