A little less than four years ago, I wrote a post about home prices in Silicon Valley and how they relate to stock prices and Bitcoin. It was one of the most popular posts on my blog from 2017.
The original compared housing prices in Palo Alto to a few of the largest technology companies in Silicon Valley, with Bitcoin added just for fun. Given the incredible rise in technology stock prices and Bitcoin in the past few years, it seemed worthwhile to update the data in the original post.
Talking about home prices in Silicon Valley is always a sensitive topic, because the lack of affordable housing continues to be a both difficult and heavily political topic. As someone who grew up here, it seems painfully obvious that the primary problem is the overwhelming resistance of local city councils to approve housing unit construction that meets ever increasing demand.
This post isn’t about that issue.
Instead, this is an attempt to look at the housing market through another lens. Most financial estimates of housing cost tend to compare the price of housing to incomes, which makes sense since for most people in most places, the affordability of a home is directly related to the size of the mortgage that they can obtain for that home. In general, houses are purchased based on income, not assets.
In Silicon Valley, of course, income looks a bit different since many people in Silicon Valley work for technology companies, and most technology companies compensate their employees with equity.
Palo Alto Home Prices
I chose Palo Alto as a proxy for Silicon Valley home prices because it is historically “ground zero” for Silicon Valley tech companies, and it has relatively close proximity to all of the massive tech giants (Apple, Google, Facebook).
The original post started the data sets in June 2012, since this was roughly when Facebook became a public company. For this post, I’ve extended the data sets all the way to March 2021.
All housing prices have been sourced from Zillow. All stock prices have been sourced from Yahoo Finance, and reflect the price adjusted for dividends. All Bitcoin prices have been sourced from Investing.com.
This is what Zillow looks like today for Palo Alto: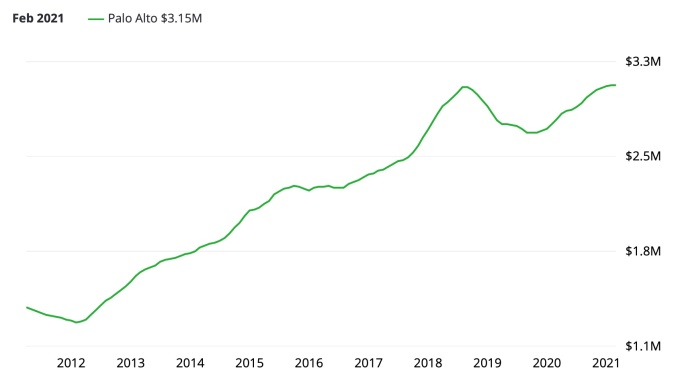
As you can see, in June 2012, the average Palo Alto home cost $1.44M. Roughly five years later, in June 2017, that average price was up 84.6% to $2.55M. Now, in March 2021, that price has risen a total of 117.9% to $3.15M.
That’s certainly a much faster increase than any normal measure of inflation, whether looking at changes in prices or wages. But what happens if we look at those increases in comparison to the stocks of some of the largest technology employers in Silicon Valley?
Apple ($AAPL)
Apple is the most valuable public company in the world right now, measured by market capitalization ($2.023 Trillion as of March 18, 2021), and second most profitable ($55.256B in 2020). Thanks to their exceptional financial performance, Apple stock ($AAPL) has increased significantly since June 2012, rising (split-adjusted) from $18.79 per share to $124.76 in March 2021. That’s a gain of over 565.8%.
Wow. 😳
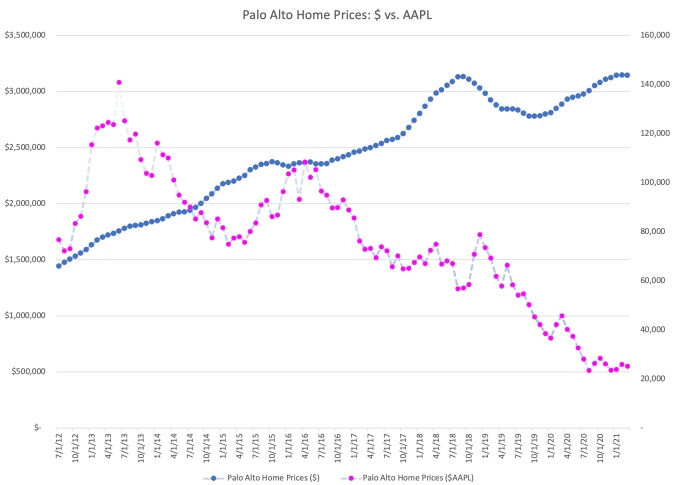
Let’s look at Palo Alto home prices as measured in dollars, and then let’s look at them in comparison priced in shares of $AAPL.
This chart tells a very different story than the one from 2017.
In the five years from June 2012 to June 2017, Apple stock was volatile, but over the entire time period almost exactly matched the growth in Palo Alto home prices. However, the run up since 2017 has been incredible.
Split-adjusted, it took 76,839 shares of $AAPL to purchase the average home in Palo Alto. By March of 2021, that number had dropped to only 25,216 shares.
This isn’t surprising, since Palo Alto home prices are only up 117.9% over that time period, and Apple shares are up 564%. But what this means from a practical viewpoint is that for people converting one asset (Apple stock) into another (Palo Alto housing), it has become easier, not harder, to purchase the average home.
Google ($GOOGL)
Google tells a similar story to Apple in 2021, even though that wasn’t the case in the original post. Since 2017, Apple stock has clearly outperformed Google, leaving them with almost identical price increases from June 2012. (By itself, that’s somewhat of an amazing fact given the relative ages of the two companies).
As of March 2021, Google has a market capitalization of $1.37 Trillion, significant less than Apple’s. However, they have seen price appreciation of 557.3% since June 2012, rising from a split-adjusted $316.80 per share to an amazing $2,082.22 per share in March 2021.
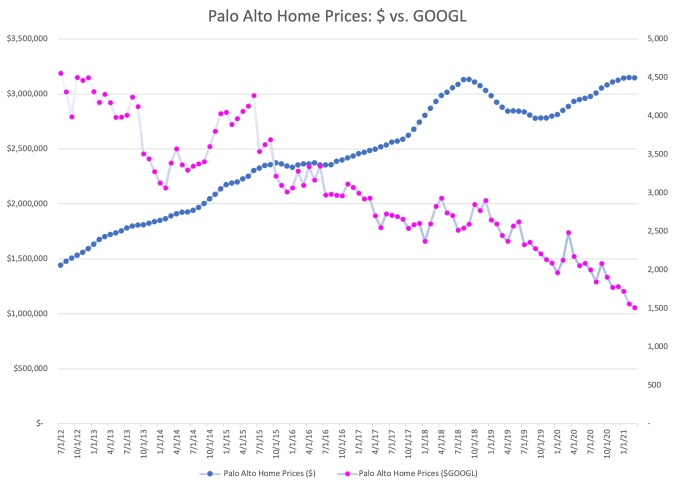
Let’s look at Palo Alto home prices as measured in dollars, and then let’s look at them in comparison priced in shares of $GOOGL.
If you compare this chart to the one for Apple, it tells a different story but has a similar ending. Google shares are clearly more volatile than Palo Alto housing, but they have fairly consistently appreciated over the past decade.
In June of 2012, it would have taken 4,557 shares of Google stock to purchase the average home in Palo Alto. By March 2021, that number had dropped to only 1,511 shares.
So while Palo Alto home price appreciation has been tremendous by any historical measure, Palo Alto housing has become cheaper in the past decade for people holding Google stock, and more expensive for people holding dollars.
Facebook ($FB)
Facebook, the youngest of the massive tech giants, already has one of the largest market capitalizations in the world. As of today, Facebook is valued at $793.4 Billion. Facebook stock has risen an incredible 1208.2% since June of 2012, from a price of $21.71 per share to a price of $284.01 in March 2021.
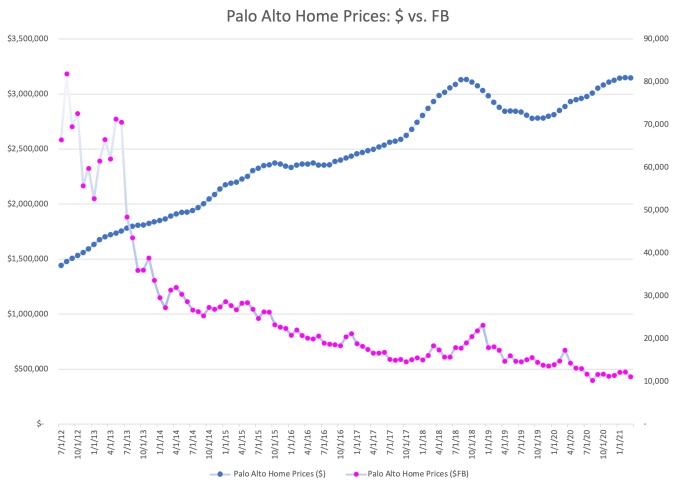
At this point, you know how this story goes. With growth of over 1200%, Facebook stock goes a lot further in 2021 than it did in 2012, even against daunting Palo Alto housing prices.
In June of 2012, it would have taken 66,500 share of Facebook to purchase the average home in Palo Alto. By March of 2021, that number was down to just 11,077 shares. Quite incredible.
Bitcoin ($BTC)
While I realize that Bitcoin isn’t a large employer in Silicon Valley, nor is it a stock, the original idea for this post came from a joke I made on Twitter back in 2017.
Most of you likely already know the story here. Bitcoin price appreciation in the past 12 months has been unbelievably high, so looking back to June 2012 is going to be somewhat jarring.
In June of 2012, the price of Bitcoin was about $9.40. By March of 2021, it had risen to $57,326.20. That’s a gain of over 609,753%.
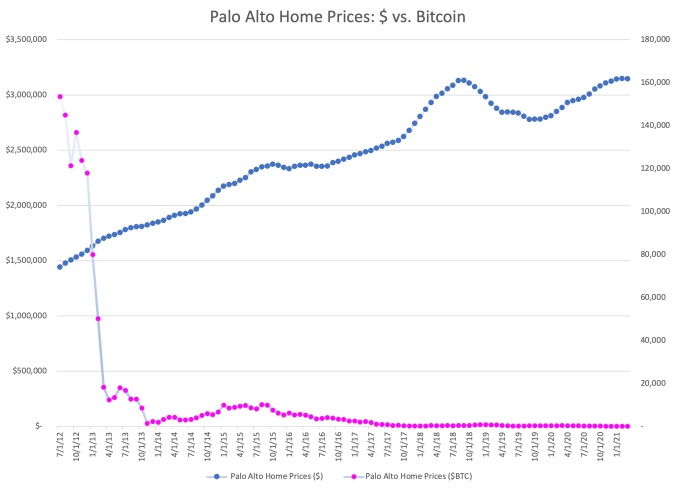
The growth rate in Bitcoin prices, as measured in US dollars, has been so incredible, this chart is almost impossible to read in recent years.
For context, in June of 2012, it took about 153,586.2 Bitcoin to purchase the average home in Palo Alto. By March of 2021, that number had dropped to just 54.9 Bitcoin.
This, of course, has a number of dramatic implications. As measured in US dollars, or in real assets like Palo Alto real estate, the wealth of Bitcoin holders has increased dramatically. As measured in US dollars, the average price of a house in Palo Alto has increased by 117.9% in less than 10 years. However, as measured in Bitcoin, the average price of a house in Palo Alto has decreased by 99.96%.
There aren’t many people who invested in Bitcoin back in 2012, but a disproportionate number of them were in Silicon Valley. However, even based on recent numbers, the story is similar.
In March of 2019, you could have purchased the average house in Palo Alto for 702.0 Bitcoin. Just two years later, in March 2021, the average house in Palo sold for 54.9 Bitcoin. That means the average home in Palo Alto, as measured in Bitcoin, has decrease by 92.2% in just the past two years alone.
Silicon Valley Is Seeing Significant Asset Inflation
These charts are not meant to imply direct causality, but in many ways they confirm several economic facts about Silicon Valley that may not be obvious when looking at nationwide statistics.
Because technology employers in Silicon Valley compensate most employees with equity, it is very likely that asset inflation in stock (and crypto) markets has some impact on the housing market. This is likely exacerbated by the lack of new housing construction in Silicon Valley.
The fact is, if you are fortunate enough to have equity in one of the tech giants, or if you have been an investor in Bitcoin, houses might actually look cheaper in 2021 than they did in 2012, or even in 2020.
What is most surprising about the data refresh is the apparent detachment of equity and crypto prices from the prices of Palo Alto real estate. There are a number of potential reasons why this might have happened. One theory is that real estate markets move relatively slowly compared to equities and crypto, and so the rapid price increases of 2020 have not yet worked their way into the market. A second theory is that large technology company compensation has been shifting away from stock options to RSUs, leading employees to hold less stock as they convert their shares to cash on vesting. A third theory is that we’re seeing complicated effects from COVID, as windfall money from equity and crypto markets may be flowing into other places rather than local real estate.
(Before the San Francisco crowd gets too rowdy, there is absolutely no evidence yet that more money is flowing into San Francisco real estate instead of Palo Alto this cycle.)
In any case, whatever the reasons may be, it is always worth checking the actual data to see whether it confirms or contradicts our intuition.
Let’s check back in another four years.

